the question was about US and Switzerland only. The graph shows the position of ...
Réponse publiée sur Quora
the question was about US and Switzerland only. The graph shows the position of the “Social Democratic Party” of Switzerland I’m talking about in the answer, that’s all.
In Switzerland we have a very reliable mathematically based way of measuring the left/right positioning of parties and politicians thanks to smartvote.ch . it produces maps like these that can even be “animated” to show the political changes across time
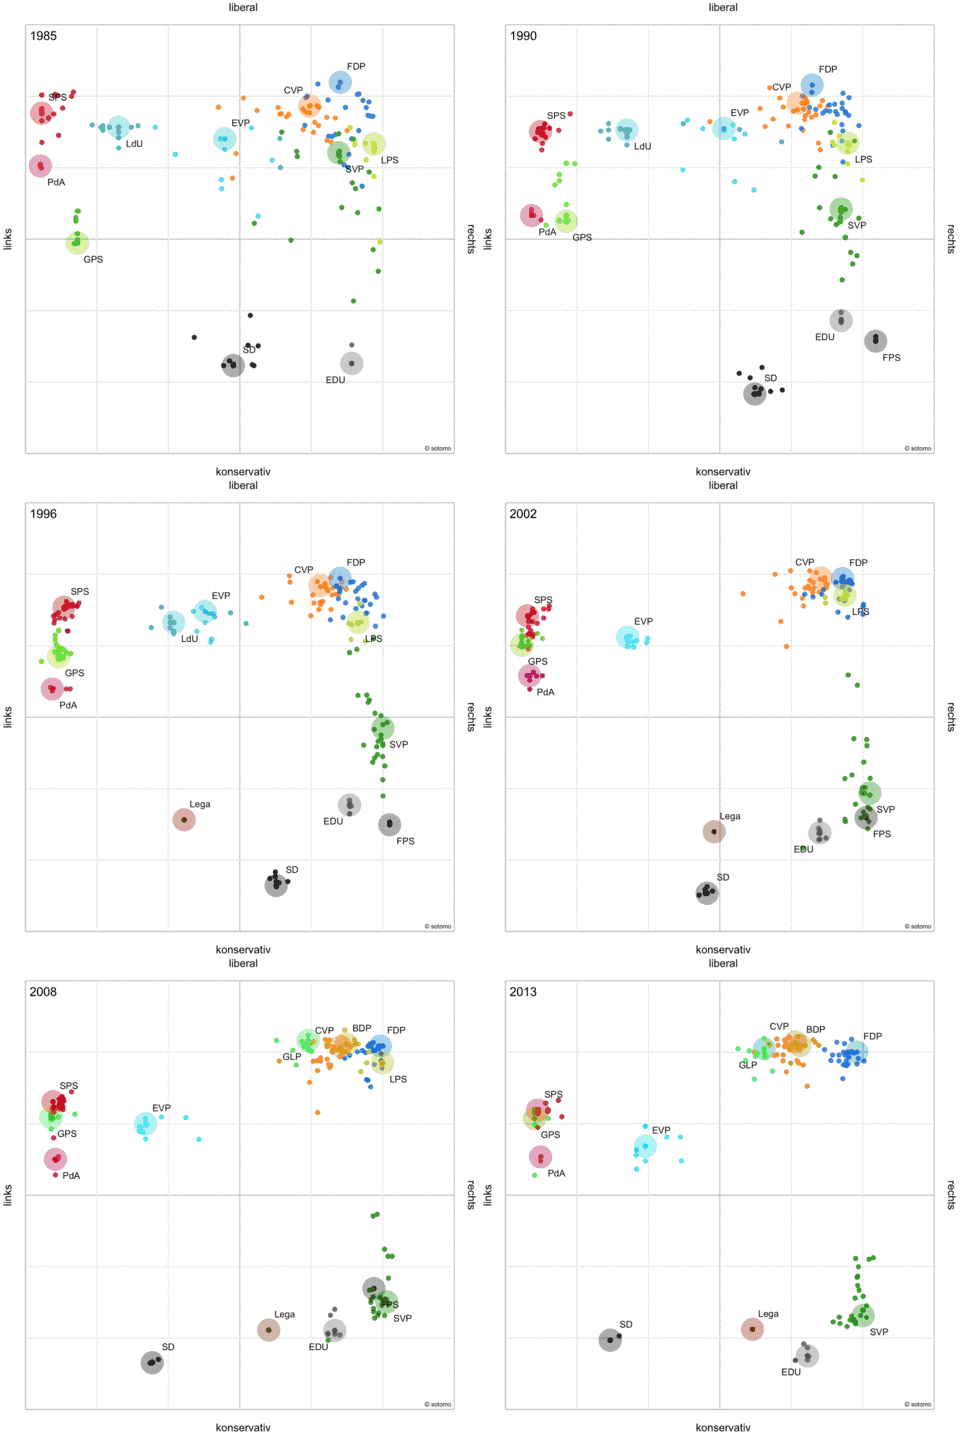
the methodology is described (in german only, sorry…) here : https://sv19.cdn.prismic.io/sv19…
I just noticed Australia has adopted this approach : https://act.smartvote.org/en/abo…
(and I started to apply the method to France here : GitHub - goulu/smartvoteFR )
Use the same approach in the US and we will have an objective way to compare ;-)

Sur le même sujet
- actually when I looked for a graph I found this one, but not its source. As I wr...
- numbers are correct, but there is no deforestation since long :In total, between...
- actually we had banking secrecy instead of trusts ;-)Some rich people create Fou...
- Alas, you pictured probably the most deadly place in Switzerland.Matterhorn is o...
- Federal Supreme Court of Switzerland - Wikipedia ??? It has invalided some popul...